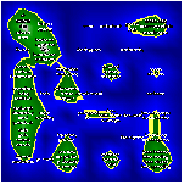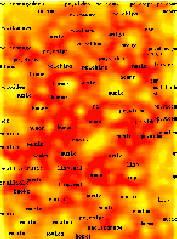
Subject: Self-Organizing Maps (SOMs) for Information Visualization During the seminar we tried to understand the principle of SOM by asking the following questions: • What is the visualization capability of SOM? • Why is it called (Self-Organizing) Map? • What does it mean by Self-Organizing? • What is a possible application of SOM? A short introduction into this subject as a result of our discussion: The Self-Organizing Map is an Artificial Network used to map high dimensional data onto a low dimensional space (usually 2D). The network consists of a number of neural processing elements (nodes or neurons) usually arranged on a rectangular or hexagonal grid, where each neuron is connected to the input. Here the neighbouring neurons in the map should represent similar data in the input space. This leads to a spatial clustering. In other words, the topology of the dataset in its n-dimensional space is captured by the SOM and reflected in the ordering of its neurons. An important feature of the SOM is the fact that it is an unsupervised learning network, a function approximation occurs only with the data, there are no examples for correct or incorrect. It adopts a learning strategy where the similarity relationships between the data and the clusters are used to classify and categorize the data. Two examples of a Self-Organizing Map:
|

